2017 Social Stats To Drive Your 2018 Strategy
Posted By Jessica Ivetich on January 05, 2018
New year, new social strategy, but that doesn’t mean leaving the data of 2017 behind. Last year’s social data is packed full of valuable insights to drive your social strategy into the new year. For example, at Social Media Week Chicago we learned that paid social media efforts will triple in size within the next five years, a fact that will completely transform many social programs. But that’s just a start. We’ve pulled together stats for all of the top platforms to focus and strengthen your social strategy this coming year and beyond.
Responsible for making the #hashtag what it is today, Twitter is arguably the most in-the-moment social media platform. Twitter users thrive in real-time, covering everything from comedy to political campaigns, and making so much noise that it’s sometimes difficult for brands to stand out. That’s why keeping your target as tuned to this platform as possible is key to breaking through. Keep these stats in mind to help bring your brand to the center of the Twitterverse:
- Twitter’s 328 million monthly active users are evenly split by gender.
- There are 70 million U.S. users, but 79% of all accounts are outside of America.
- Tweets with images receive 18% more click throughs, 89% more likes, and 150% more retweets.
- Tweets with images are 150% more likely to get retweets, and tweets with video are six times more likely to be retweeted.
- Tweets shorter than 100 characters get a 17% higher engagement rate.
- The ideal hashtag length is under 11 characters, with the target of 1–2 hashtags per tweet.
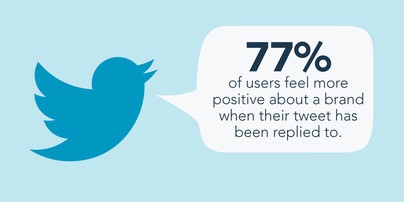
- Tune in to your users: 47% of marketers agreed Twitter was the best social media channel for customer engagement and 77% of Twitter users feel more positive about a brand when their Tweet has been replied to.
- Advertisers are planning to spend 21% less on Twitter next year.
Holding strong as the behemoth of the social media world, Facebook is often viewed as a must-use for social media marketers. But over the past year, the platform has implemented a slew of updates shifting preference away from brands. It’s not quite time to give up on the social media giant just yet for organic content, however. Here are the must know stats:
- 91% of millennials are on Facebook, and 41% of millennials use the Social Network every day.
- With over 2 billion users (38.6% of the global online population), Facebook remains the biggest social network worldwide.
- Facebook users upload 300 million photos and watch 100 million hours of video each day.
- While the maximum length of a status update is 63,206 characters, the ideal status length is only 40 characters long.
- The ideal video length on the platform is about a minute long.
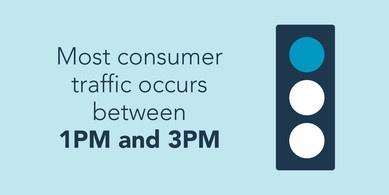
- Facebook takes up 22% of the time that Americans spend online on mobile devices, with most user traffic occurs between 1pm and 3pm.
- 60 million businesses have a Facebook profile/page, while only 4 million are actively advertising, and 75% of brands promote their Facebook posts.
For all things visual, Instagram is the place to be. The photo-based social platform’s Stories feature has helped push Instagram’s population to over 800 million monthly active users in 2017. On the tails of an algorithm change for the platform, consider these stats to continue making a splash:
- Instagram has 500 million daily active users and over 200 million business profiles.
- 95% of Instagram users are 35 and under.
- 80% of Instagram users are outside of the U.S.
- There’s little correlation between caption text length and engagement rate on Instagram, but the average caption is 138 characters long.
- Photos showing faces get 38% more Likes than photos not showing faces, and images with a single dominant color generate 29% more Likes than those with multiple dominant colors. A high amount of negative space within an image also generates 29% more Likes.
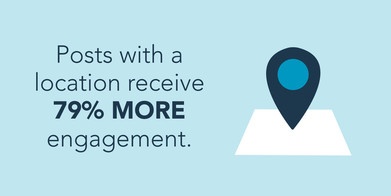
- Posts that tag another handle gain 56% more engagement, while posts with a location receive 79% more engagement. Adding at least one hashtag increases engagement on an average of 12.6%.
- 32% of US teens list Instagram as their most important social network, and U.S. adult Instagram users have doubled since 2012.
- 75% of Instagram users take action, such as visiting a website, after looking at an Instagram advertising post.
- 60% of the top brands on Instagram use the same filter for every post, and most top brands post 4.9 times per week.
- Engagement with brands on Instagram is 10 times higher than Facebook, 54 times higher than Pinterest, and 84 times higher than Twitter.
Snapchat
As the first social platform based on ephemeral content, mastering marketing on Snapchat continues to be a learning process. While 2017 was a little rough for Snapchat, Snap, Inc. CEO Evan Spiegel announced an upcoming Snapchat redesign, focusing on a new algorithmic feed and increased abilities for advertisers. Time will tell the platform’s success, so take a look at the final stats from Snapchat as we know it:
- 60% of users are under 25, and nearly a quarter (23% have not yet graduated from high school.
- Of its 166 million daily active users, more women use Snapchat than men, making up 70% of its users.
- A Geofilter delivered to a national audience will typically be seen by 40% to 60% of daily Snapchatters.
- 25% of global Snapchat users access the service more than once per day
- Snapchat is the most popular social media site among American teenagers and young adults, ranking ahead of
- Tumblr and Twitter in terms of U.S. Millennial user engagement.
- On average, users spend 25 to 30 minutes in the app each day, checking the platform about 18 times.
- Brands are charged an average of $750,000 per day to advertise on Snapchat.
- 58 percent of college students would be likely to purchase a brand’s product or service if they were sent a coupon on Snapchat.
- 69% of college students say they would be more inclined to open a Snap from a brand than an individual they don’t know.
LinkedIn is the go-to social platform for professional content, making it key for B2B marketers. After the platform was acquired by Microsoft, LinkedIn introduced updates like the Audience Network and a push for video content. Here’s how to keep your brand looked polished and professional:
- Of the 500 million LinkedIn users, 56% are male and 44% are female.
- 13% of millennials use LinkedIn, and 40 million members are either students or recent graduates.The platform spans generations, as 13% of baby boomers also use LinkedIn.
- LinkedIn posts with images receive 200% more engagement than text-only posts, and 98% of LinkedIn posts with images earn more comments than text-only posts.
- More than 1 million people use LinkedIn’s publishing platform, sharing over 130,000 posts each week.
- Posts with titles containing 40-49 characters get the most overall views.
- How-to posts perform best, while posts where the headline poses a question tend to perform poorly.
- Divide your post into 5 headings in order to attract the greatest number of post views.
- New employees sourced through LinkedIn are 40% less likely to leave the company within the first 6 months, and the average CEO has 930 connections.
- 57% of companies have a LinkedIn Company Page, and 94% of B2B marketers use LinkedIn to distribute content.
As 2018 gets underway, don’t leave last year completely behind. Analyzing 2017’s data to learn from successes and mistakes and to make an informed plan for what’s next is a big part of making sure this is your brands’ best social year yet.


